Maps/Infographics published in New World Outlook magazine.
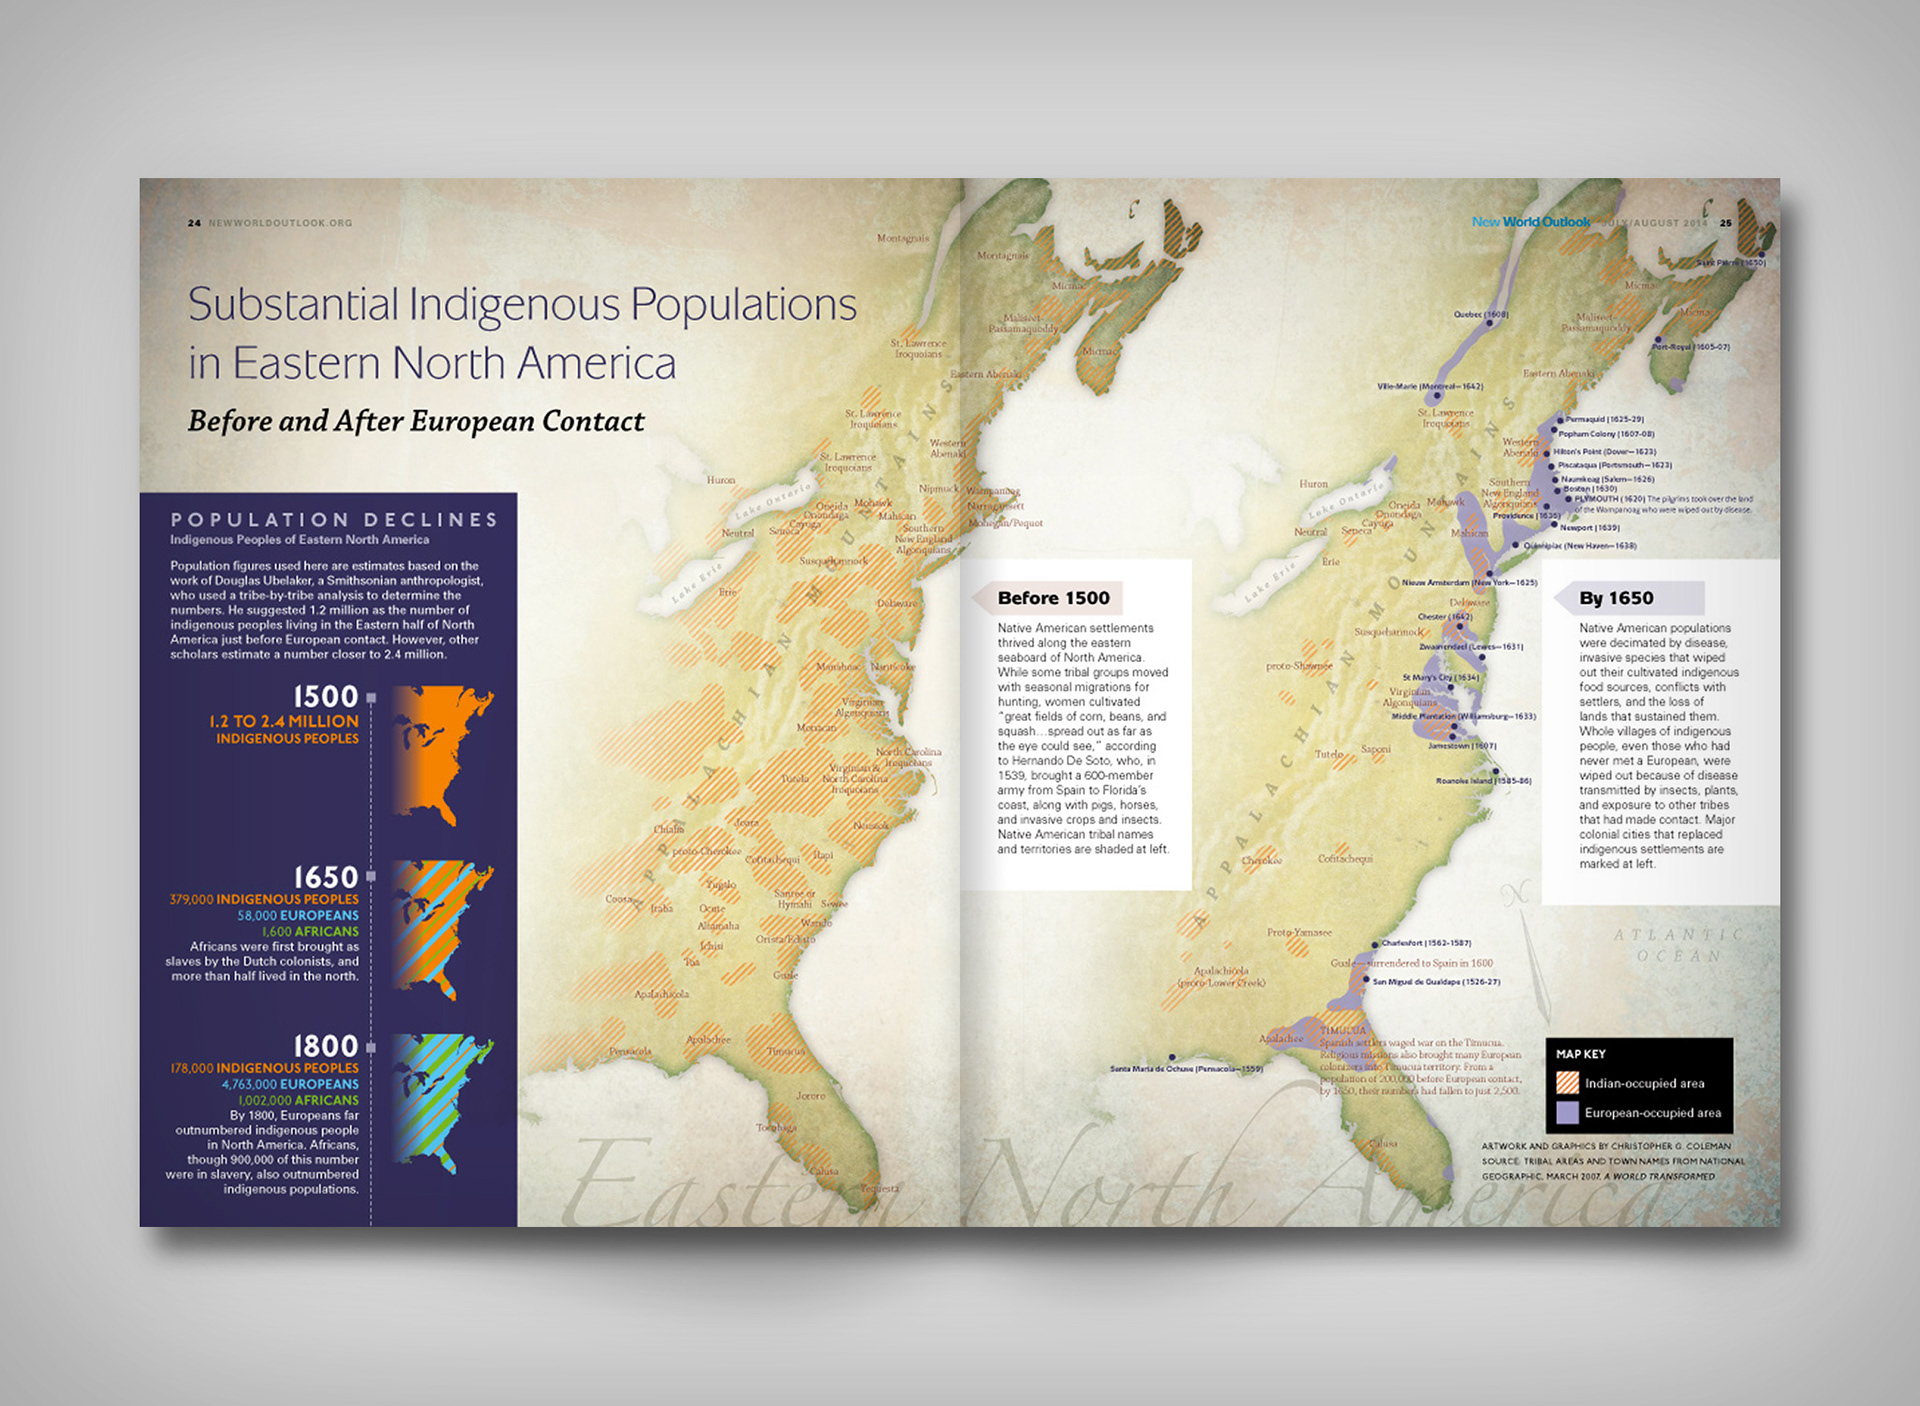
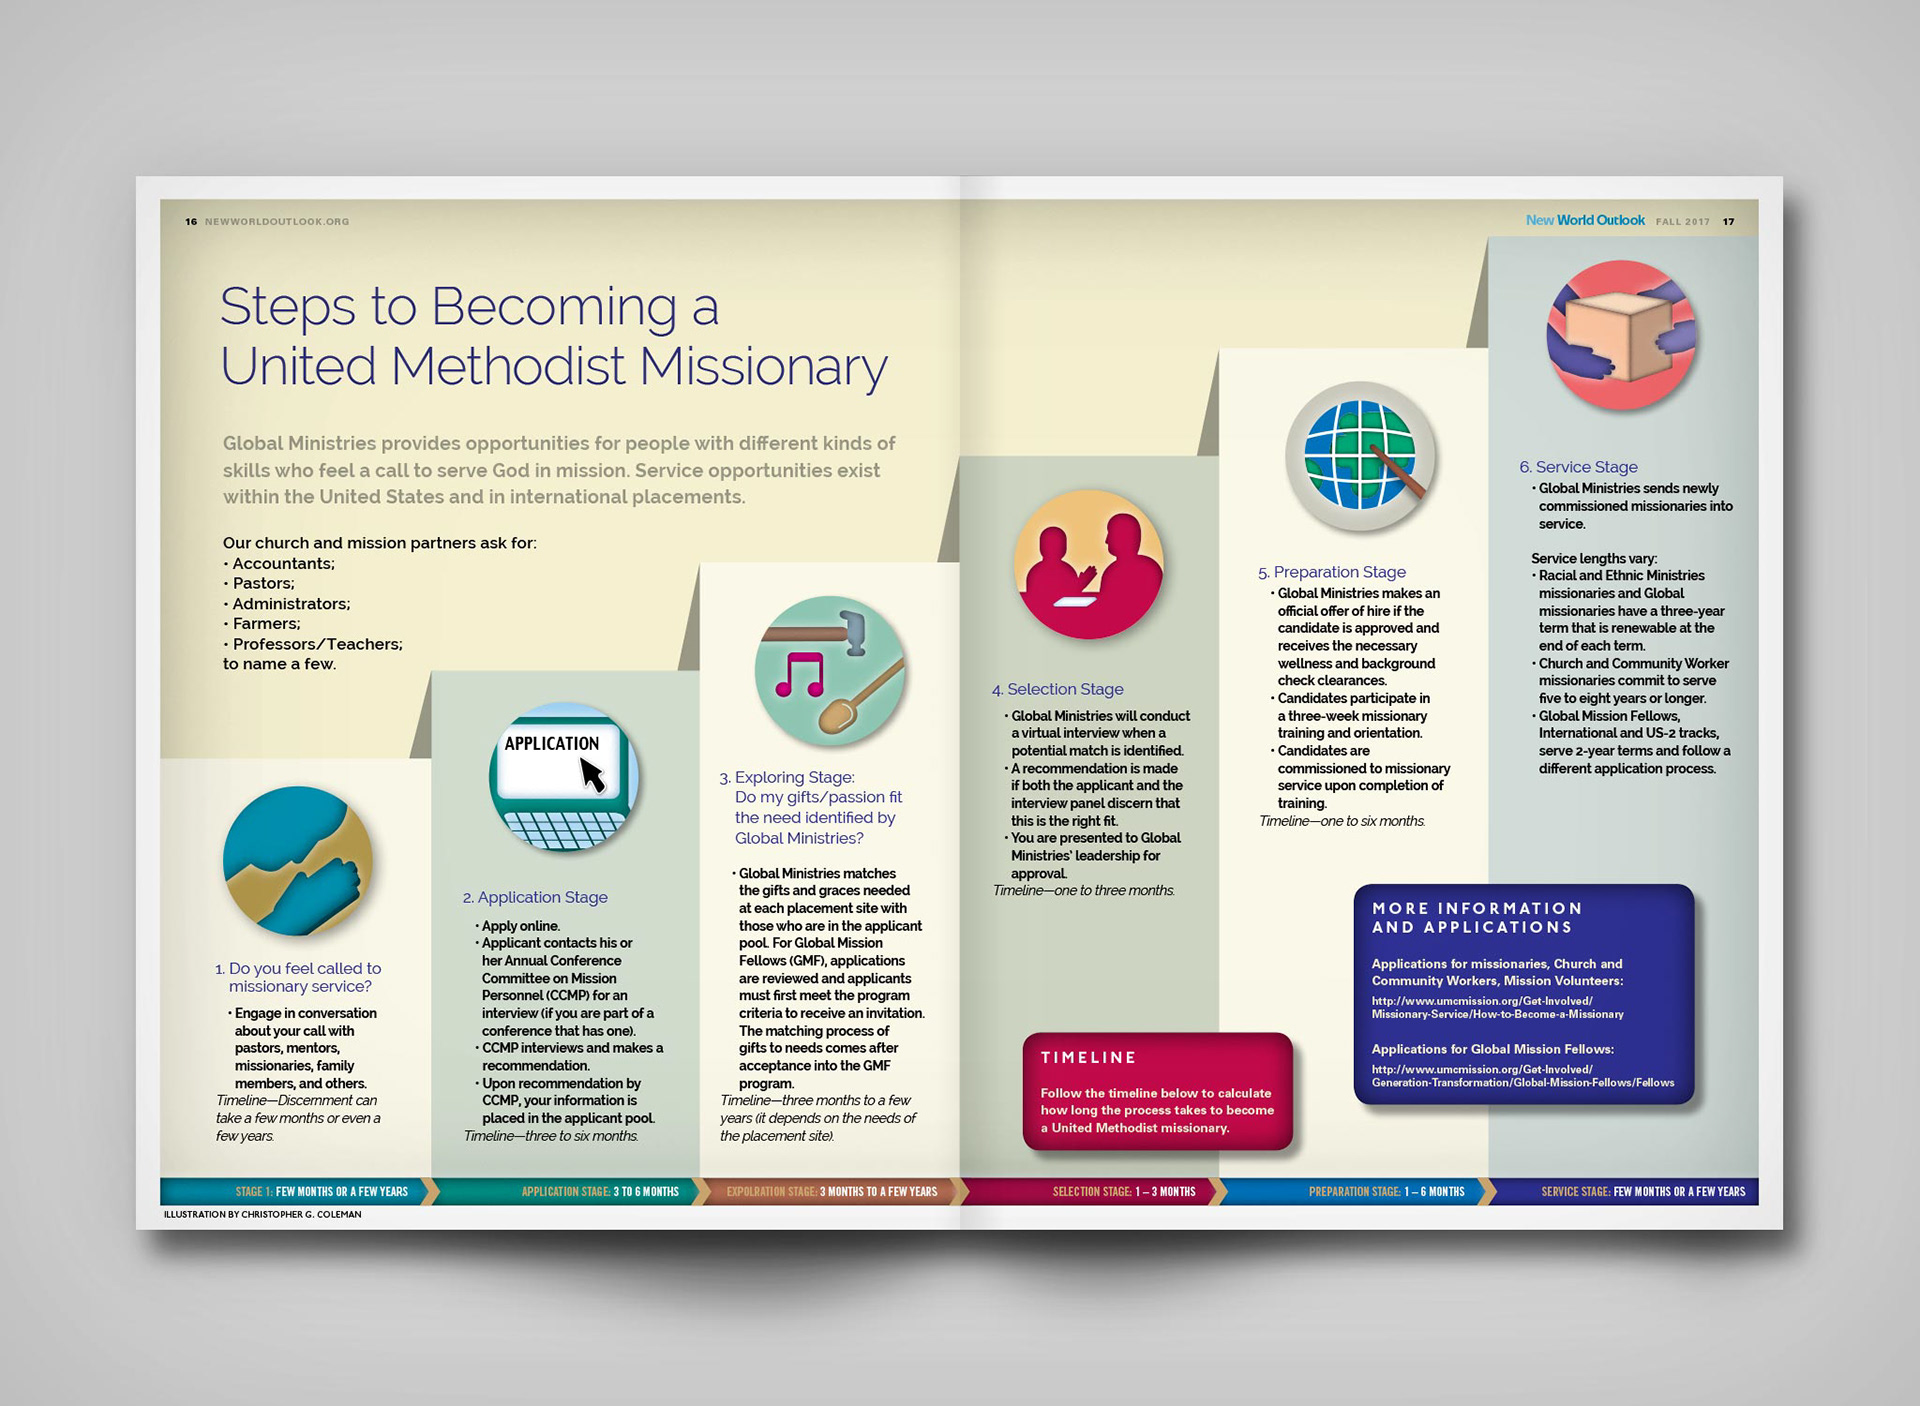
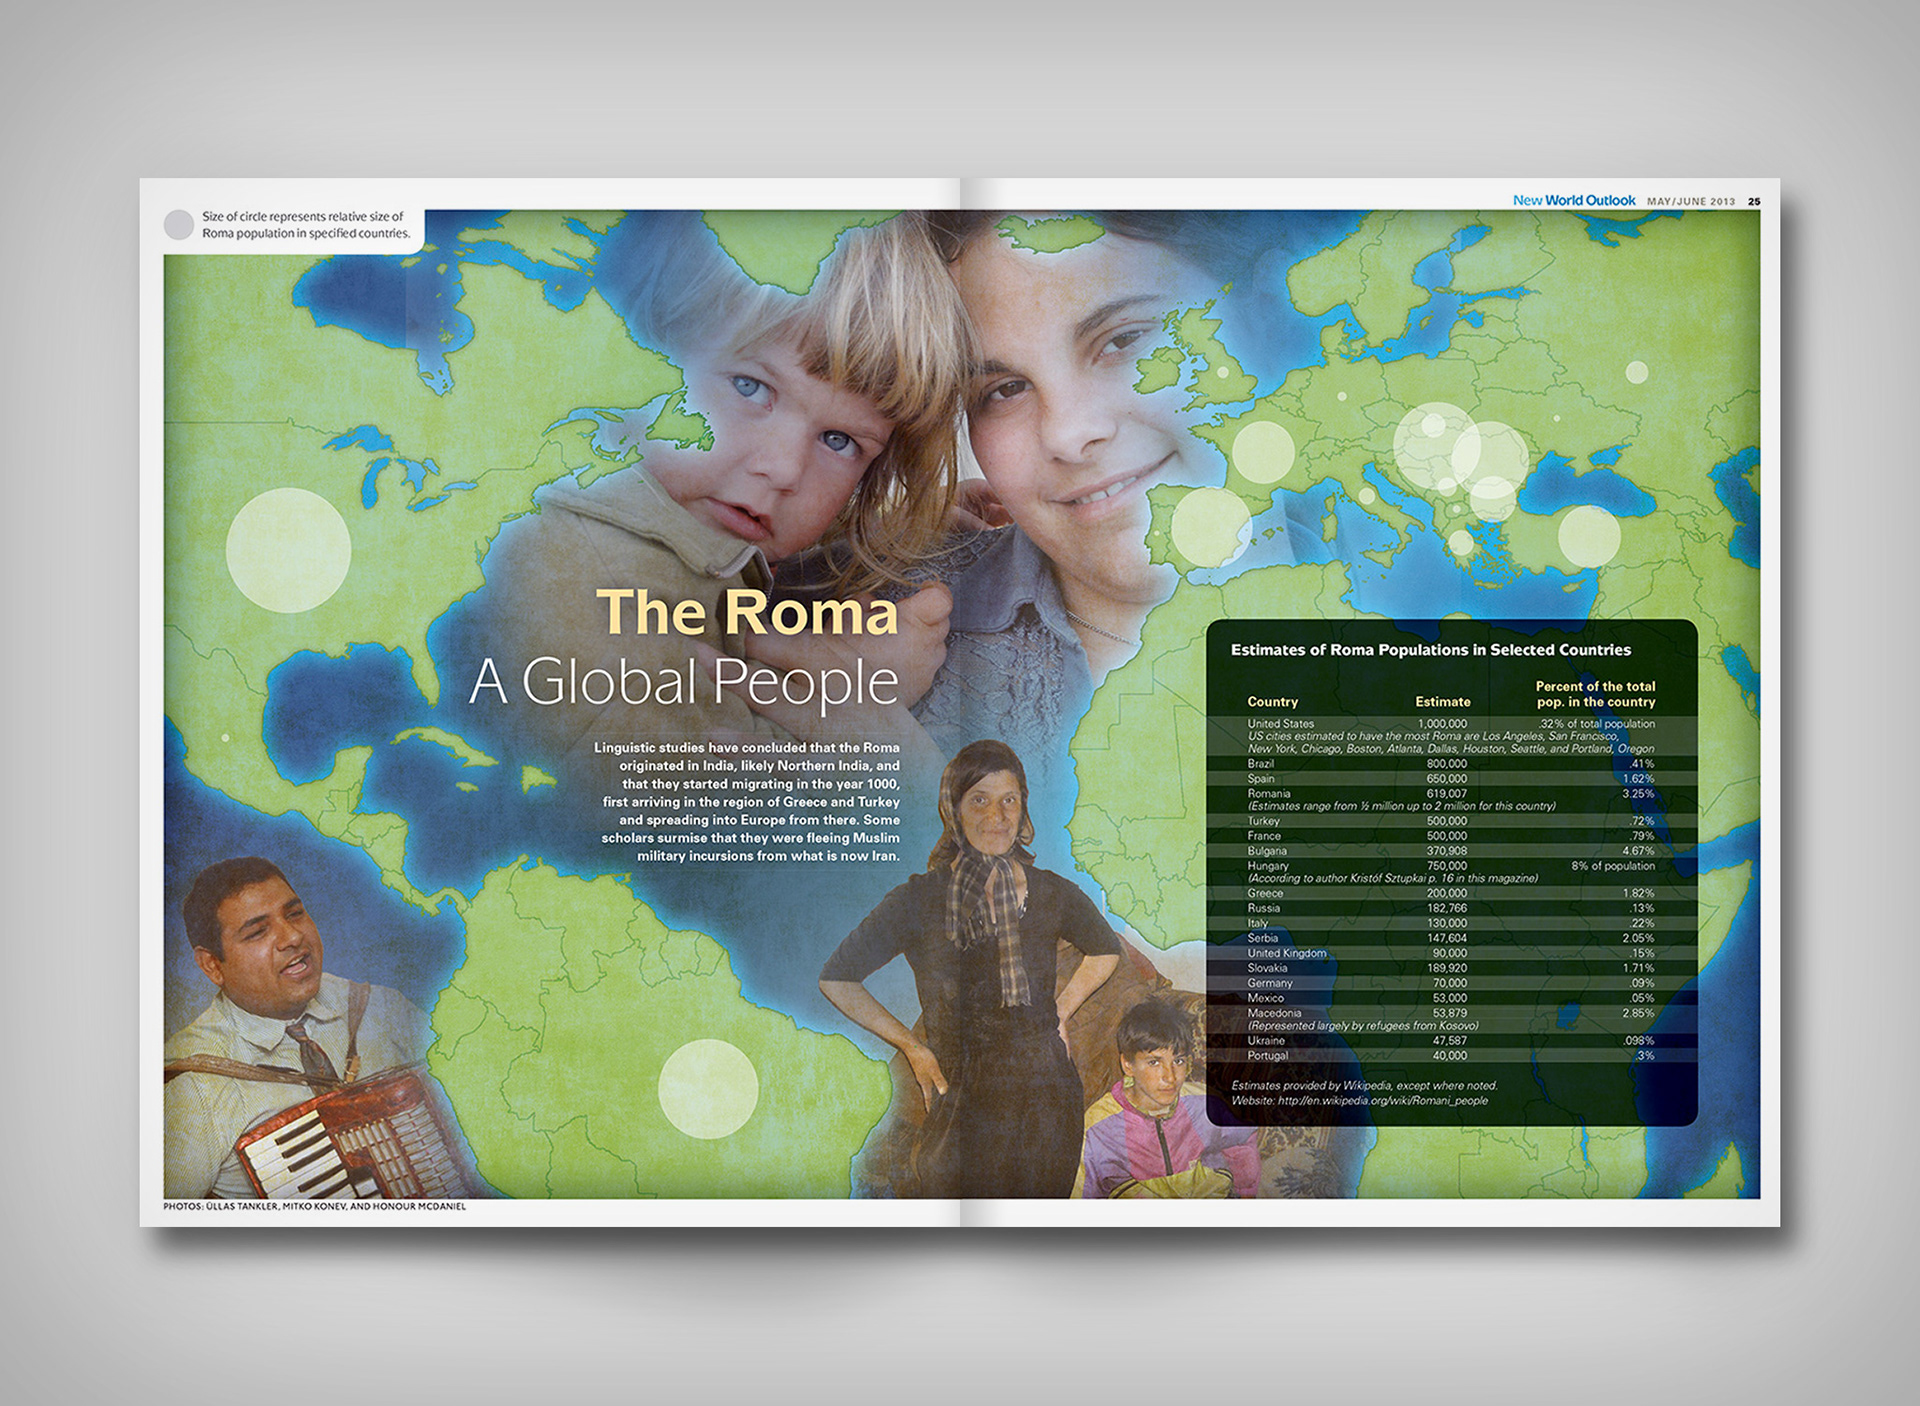
The upper left graphic shows the drastic reduction in the population of indigenous people in Eastern North America from the time Europeans set foot in the Americas to recent times. The upper right graphic illustrates the population of Roma people around the world. Below is an infographic depicting the steps to becoming a missionary in the United Methodist Church.
The upper left graphic shows the drastic reduction in the population of indigenous people in Eastern North America from the time Europeans set foot in the Americas to recent times. The upper right graphic illustrates the population of Roma people around the world. Below is an infographic depicting the steps to becoming a missionary in the United Methodist Church.